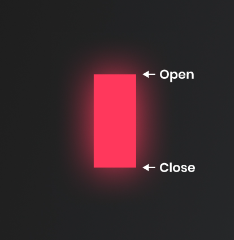
Historical Background
Candlestick charting originated in 18th-century Japan, developed by a rice trader to analyse market psychology and anticipate price movements.
Over time, this charting method evolved into the global standard for analysing market behaviour and price action.
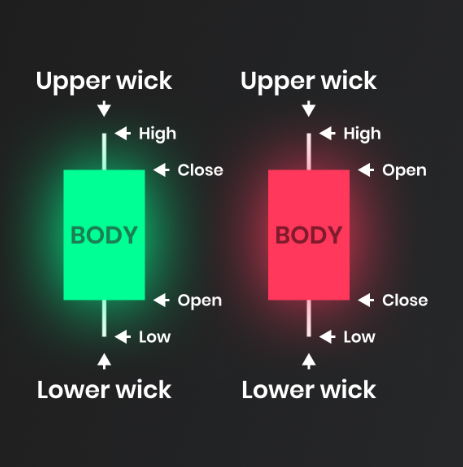
1. Anatomy of a Candlestick
Understanding the structure of a candlestick is fundamental to interpreting price action. Each candlestick represents the price movement of an asset within a specific time interval (for example, one minute, one hour, or one day).
A candlestick consists of two main components:
- The Body
- The Wicks (Shadows)
Body
The body is the thick rectangular portion of the candle.
It displays the difference between the opening and closing prices of the selected time period.
- When the closing price is higher than the opening price, it is called bullish candle and typically coloured green or white.This indicates that the price increased during the period.
- When the closing price is lower than the opening price, it is called bearish candle and usually coloured red or black, signifying a price decline.
Wicks (Shadows)
The wicks (thin lines above and below the body) represent the highest and lowest prices traded within the same time period.
- The upper wick extends from the top of the body to the period’s highest price.
- The lower wick extends from the bottom of the body to the lowest price.
Together, the body and wicks provide valuable insight into market sentiment, volatility, and the balance between buyers and sellers.
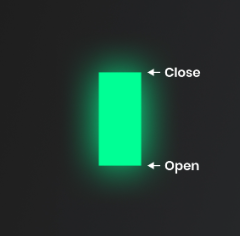
2. Long Bullish Candle
A long bullish candle features a large green body with short or absent wicks.
This pattern indicates that buyers were dominant throughout the trading session, closing the price substantially above the opening level.
It often appears:
- Within an uptrend, confirming bullish strength.
- At the end of a downtrend, signalling a potential bullish reversal.
Significance: Bullish

3. Long Bearish Candle
A long bearish candle is represented by a large red body with minimal or no wicks.
It shows that sellers controlled the price movement, closing significantly lower than the opening price.
This pattern typically:
- Confirms strength during a downtrend.
- Suggests a potential bearish reversal if appearing near the top of an uptrend.
Significance: Bearish

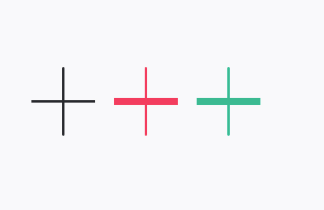
4. Doji
A Doji forms when the opening and closing prices are nearly identical, creating a small or non-existent body and long wicks on both sides.
This pattern represents market indecision, where neither buyers nor sellers have established clear control.
Significance: Potential Bullish or Bearish Reversal
Common Doji Subtypes:
| Type | Description | Typical Implication |
| Dragonfly Doji | Long lower shadow, no upper shadow | Suggests bullish reversal |
| Gravestone Doji | Long upper shadow, no lower shadow | Suggests bearish reversal |
| Long-Legged Doji | Long upper and lower shadows | Indicates high market indecision |
5. Hammer
A Hammer candle has a small body near the top of its range and a long lower wick—at least twice the length of the body—with minimal or no upper wick.
It reflects a situation in which sellers initially drove prices lower, but buyers regained control and pushed the price back up by the close.
This pattern often indicates:
- A bullish reversal when it appears at the bottom of a downtrend.
- A continuation signal during an uptrend.
Significance: Bullish Reversal

6. Hanging Man
The Hanging Man pattern resembles the Hammer but forms after an uptrend.
It has a small body near the top and a long lower wick, suggesting that selling pressure is emerging even as the price closes near its open.
This pattern often indicates:
- Buyers are losing strength
- Sellers are beginning to dominate
Significance:Bearish Reversal

7. Spinning Top
The Spinning Top has a small body with long upper and lower wicks, resembling a Doji but with slightly more price movement.
It represents a tug-of-war between buyers and sellers that results in a narrow closing range.
This pattern often indicates:
- Indecision or a temporary pause in market direction
- Often preceding a breakout or reversal.
Significance: Pause or Reversal

8. Marubozu Bullish
A Bullish Marubozu is characterised by a long green body with no upper or lower wicks.
The open equals the low, and the close equals the high, signifying that buyers maintained full control from start to finish.
This pattern often indicates:
- Strong bullish sentiment
- Often seen in the early stages of an uptrend or during periods of strong market continuation
Significance: Bullish
9. Marubozu Bearish
A Bearish Marubozu features a long red body without wicks.
The open equals the high, and the close equals the low, indicating uninterrupted selling pressure throughout the period.
This pattern often indicates:
- Decisive control by sellers
- Frequently observed in downtrending markets or as confirmation of a bearish continuation
Significance: Bearish