
Within a trading terminal, financial markets can be observed across multiple timeframes, such as the 1-minute, 5-minute, 15-minute, hourly, daily, or weekly intervals. These varying timeframes enable traders and analysts to examine both short-term fluctuations and long-term trends.
Candlesticks collectively form trends, which represent the general direction of price movement—upward, downward, or sideways.
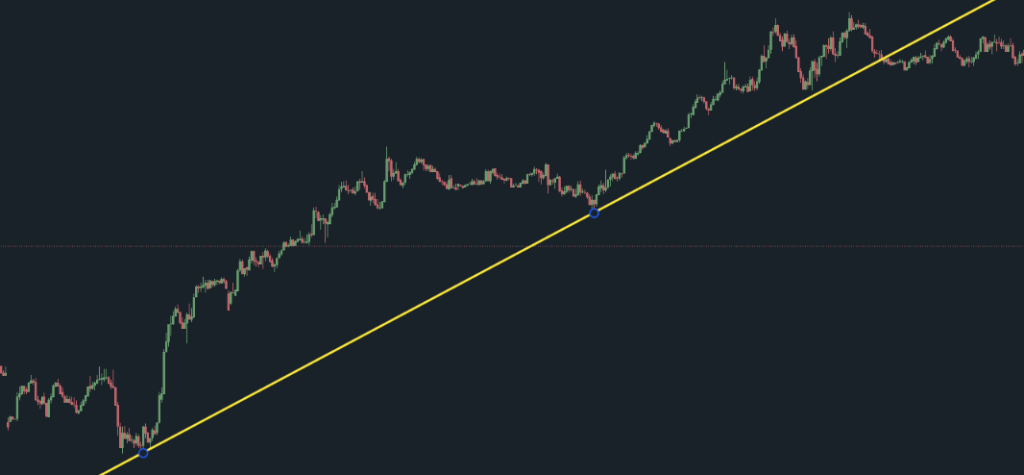
Trends form the foundation of technical analysis, as they reveal the dominant sentiment within the market. The well-known trading principle “The trend is your friend” emphasizes the importance of aligning trading decisions with the prevailing market direction.
1. What is an uptrend?
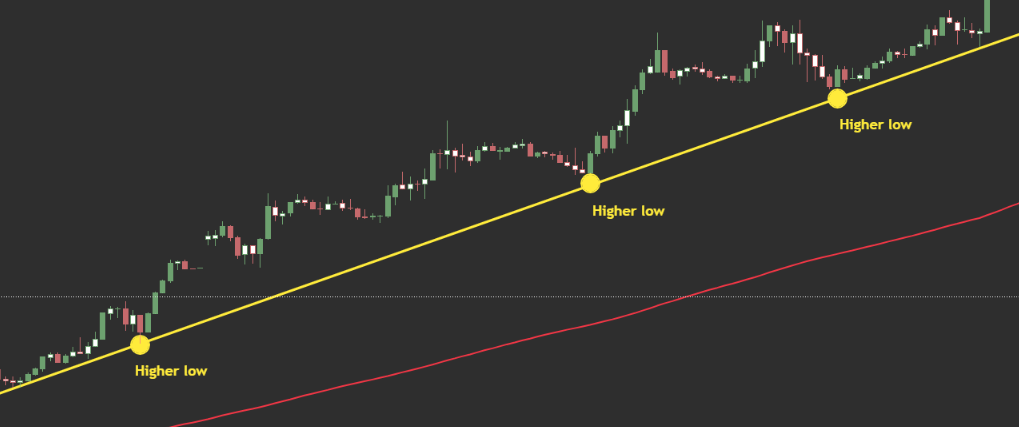
An uptrend is when you see the chart generating higher-highs, and higher-lows, usually consisting of at least two, or more, higher-highs and lows.
As long as the price stays above the previous low, the chart is likely going to continue upward, incidentally following the trend.
When the price breaks below the uptrend line, it’s a signal that the uptrend might be coming to an end, and a reversal may occur.
The 200-Period Exponential Moving Average (EMA) is frequently applied as a secondary confirmation tool for trend direction.
- When the price remains above the 200 EMA, the market is considered to be in an uptrend.
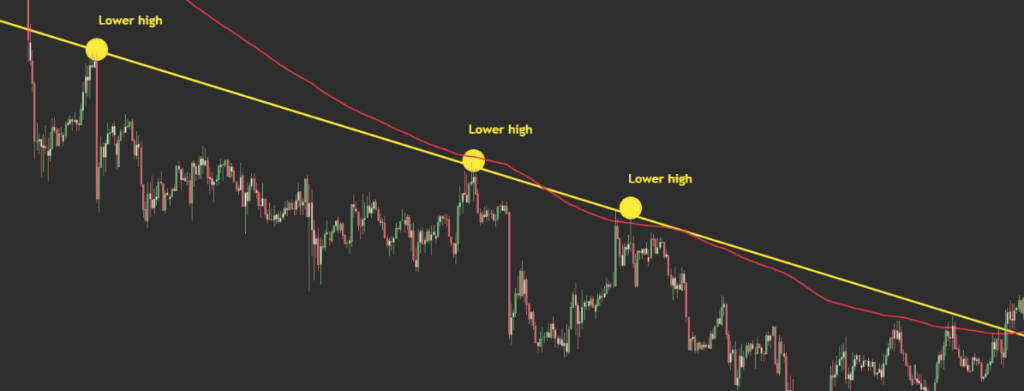
- If the price begins to approach or cross below the 200 EMA, this may signal a potential transition into a downtrend.
2. What is a downtrend?
A downtrend follows the same principle as an uptrend, but instead, the market begins producing lower highs and lower lows. It is a signal that the market has turned bearish, and this will signal to the trader to search for potential shorting positions.
When evaluating trends, it is essential to incorporate multiple timeframes. A market may appear to be in an uptrend on a lower timeframe (e.g., 1-hour), while the broader daily trend could still be bearish. Generally, the higher timeframe should take precedence, as it provides a more reliable view of the overall market direction.
3. What is consolidation?
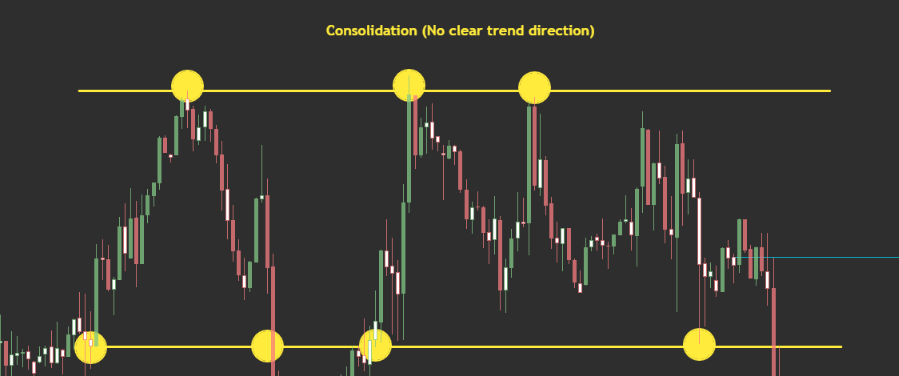
Consolidation is basically when the market is considering which way to move; it is unsure whether to move upward or down. During this phase of range-bound price movement, the market typically oscillates between defined support and resistance levels without producing a decisive breakout.
Consolidation often occurs when the market is awaiting major news, data releases, or increased trading volume. It represents a phase of indecision or balance between supply and demand.
During consolidation, market conditions tend to be neutral, and many traders choose to refrain from initiating new positions until a breakout confirms a directional bias.
4. Why is this important?
Recognizing and understanding market trends is one of the most fundamental components of technical analysis. Identifying whether the market is trending upward, downward, or sideways forms the foundation for strategic decision-making.
In practice:
- When the market structure indicates an uptrend, traders generally seek long (buy) opportunities.
- When the market structure indicates a downtrend, traders generally seek short (sell) opportunities.
Occasionally, market participants may also attempt to capitalize on pullbacks or retracements within a larger trend. However, trading in the direction of the prevailing trend remains the core principle of trend-following strategies.