
1. Definition of Liquidity
Liquidity refers to the ease with which an asset can be bought or sold in the market without causing a significant change in its price.
In the foreign exchange (Forex) market, where daily transaction volumes exceed USD 7 trillion, liquidity represents how efficiently trades can be executed at the desired price level.
When market liquidity is high, the following conditions typically occur:
- Tight spreads (minimal difference between bid and ask prices)
- Low slippage (execution close to intended prices)
- Smooth execution of large orders
Conversely, when liquidity is low, markets experience:
- Wider spreads
- Increased volatility
- Higher slippage, leading to potential deviations from intended execution prices
Liquidity can be visualized as the depth of an ocean – deep liquidity enables substantial transactions with minimal impact, while shallow liquidity leads to noticeable price disturbances.
2. Sources of Liquidity
Liquidity is generated through the continuous participation of various market participants rather than existing inherently within the market.
The primary liquidity providers include:
- Central Banks – influence overall money supply through interest rate policies and market interventions.
- Commercial Banks and Financial Institutions – execute trades on behalf of corporations, hedge exposures, and facilitate global currency flows.
- Market Makers and Brokers – continuously quote buy and sell prices, ensuring price stability and trade continuity.
- Retail Traders – although smaller in scale, their collective trading activity contributes to micro-level liquidity.
Every transaction in the market requires a counterparty. The continuous matching of buy and sell orders between participants forms the liquidity that sustains market flow.
3. Liquidity Representation on Price Charts
Liquidity is not evenly distributed across a price chart.
It tends to cluster around key price levels where orders accumulate—these are known as liquidity pools. Institutional participants frequently target such areas to facilitate large-scale trade entries or exits.
Typical zones where liquidity accumulates include:
- Swing highs and swing lows
- Equal highs and equal lows
- Above and below trendlines
- Session highs and lows
- Fair Value Gaps (FVGs) or Imbalances, often referred to as internal liquidity
Periods of price consolidation usually indicate liquidity accumulation.
Subsequent sharp breakouts often signify liquidity removal, where institutional entities absorb stop orders or execute significant order collection to initiate the next directional move.
4. Identifying Liquidity on a Chart
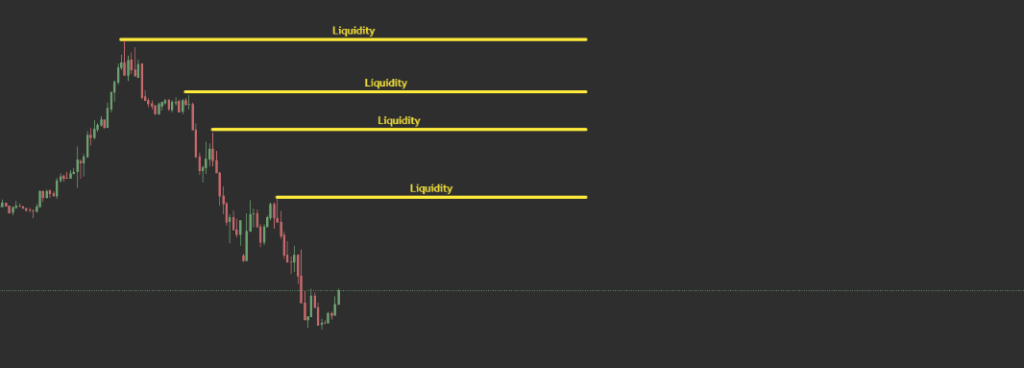
4.1 Mark equal highs/lows.
Areas of equal highs or equal lows often act as magnets for stop-loss orders.
Institutional traders commonly target these levels to trigger stop orders and access underlying liquidity before a potential reversal.
4.2 Watch previous day/week highs and lows.
Prior session or weekly highs and lows serve as natural liquidity targets.
Price action frequently sweeps one side to capture orders before reversing direction.
4.3 Identify consolidation blocks.
Consolidation ranges indicate liquidity build-up.
The initial breakout from such a range typically consumes liquidity on one side, often followed by a retracement or a continuation of the trend.
4.4 Look for session overlap times.
The London–New York session overlap represents the period of highest market volume and, consequently, highest liquidity within the trading day.
This overlap generally occurs between 13:00 and 17:00 (London time), a window often associated with major market movements.
4.5 Volume and candle clues.
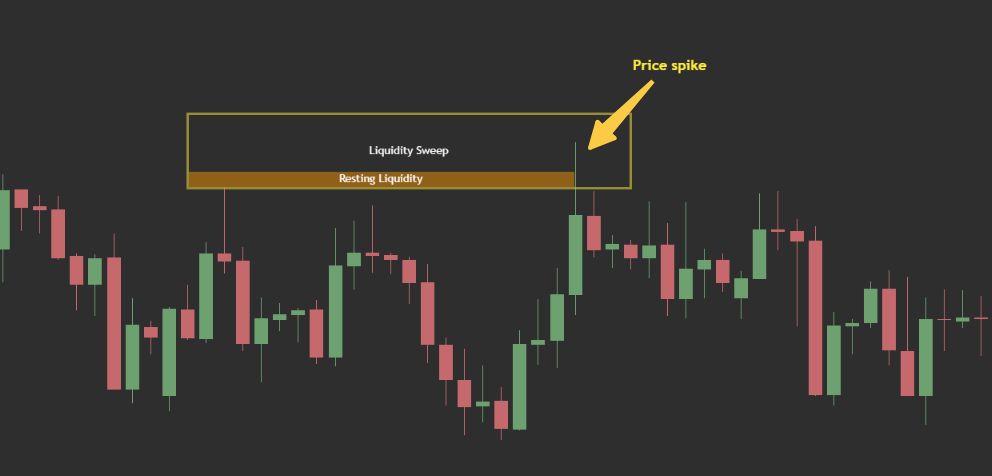
Large wicks or rejection candles frequently indicate the points where liquidity has been taken.
At such points, institutional orders are often filled, followed by a market rejection away from the liquidity zone.
5. Using Liquidity in Your Trading
Liquidity plays a crucial role in understanding market structure and price movement.
When interpreted effectively, it provides insights into market intentions and potential price direction.
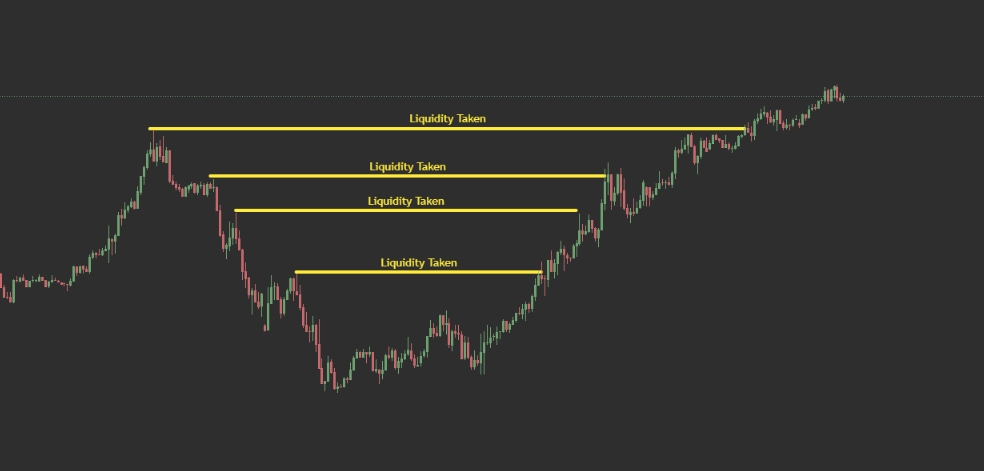
The term liquidity grab (commonly known as a stop-hunt) describes a market condition where the price briefly spikes beyond a previous high or low to trigger stop-loss orders before reversing direction.
This behaviour typically indicates the absorption of retail orders by institutional participants.
Traders often use confirmation signals such as:
- Break of Structure (BOS)
- Change of Character (CHoCH)
These signals help validate whether the market is indeed reversing after a liquidity grab.
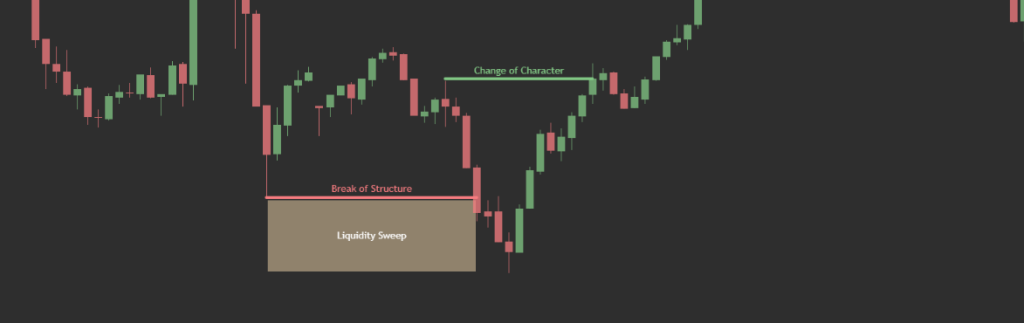
After identifying a liquidity sweep, practitioners typically determine where opposite-side liquidity may exist and designate that region as a potential take-profit target.
In essence, financial markets can be viewed as moving from one liquidity pool to another, continuously collecting orders, rebalancing, and fueling further movement.
6. Best Practices for Liquidity-Based Analysis
- Focus on trading during high-liquidity sessions, particularly the London and New York sessions.
- Avoid initiating trades in random areas, wait for liquidity grabs and confirmed structure shifts.
- Combine liquidity concepts with imbalances, such as IFVGs or CHoCH, to strengthen trade confirmation.
- Recognize that liquidity does not predict direction, it reveals the market’s intentions once liquidity has been taken.