1. Introduction to Moving Averages (MA)
A Moving Average (MA) is a technical indicator that applies statistical calculations to price data to smooth out fluctuations and highlight overall trends. It represents the average closing price of a financial instrument over a specific number of periods and connects these averaged points to form a continuous line on a chart.
The Moving Average Formula:
Moving Average = Sum of closing prices over the sample period / Number of days
For example,
A 5-day Moving Average (MA5) is calculated by summing the closing prices of the last five trading days and dividing the total by five.
This method produces a line that helps visualize the market’s short, medium, or long-term direction.
2. Applying the Moving Averages Indicator
Moving Averages are often applied in groups of two or three with varying time periods to analyze trends over multiple horizons.
A widely used combination includes:
- 9-day MA – Represents short-term momentum.
- 21-day MA – Reflects medium-term trend direction.
- 200-day MA – Indicates long-term market sentiment.
This combination allows market participants to observe how short-term movements interact with broader trend structures.
3. Interpreting Buy and Sell Signals Using Moving Averages
The crossover behavior between short, medium, and long-term Moving Averages often provides insight into potential shifts in market direction.
For example:
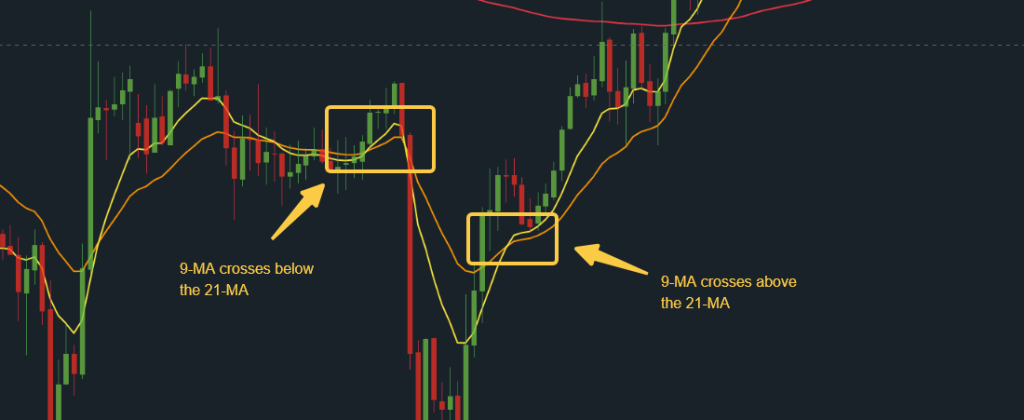
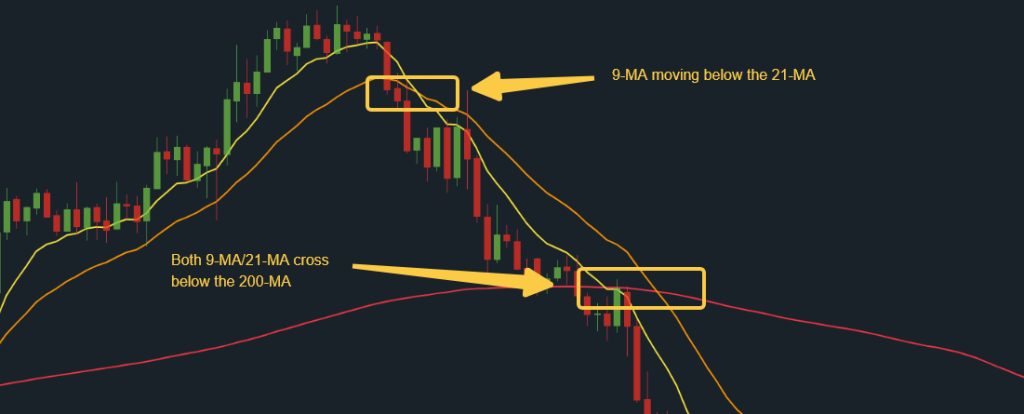
- When the 9-day MA crosses below the 21-day MA, it can indicate a potential downturn.
- When the 21-day MA crosses below the 200-day MA, this event is known as a “Death Cross”, signaling sustained bearish sentiment.
- Conversely, when shorter-term MAs cross above longer-term ones, the setup may suggest the beginning of an upward trend.
3.1 Potential Moving Average Buy Signals
Scenario 1:
When the MA begins to flatten after a period of decline and the price breaks above the MA line, this may represent a potential buy signal, suggesting renewed upward momentum.
Scenario 2:
During an existing uptrend, when a short-term MA dips near or below a long-term MA and then crosses back above, this may indicate a continuation of bullish strength.
Scenario 3:
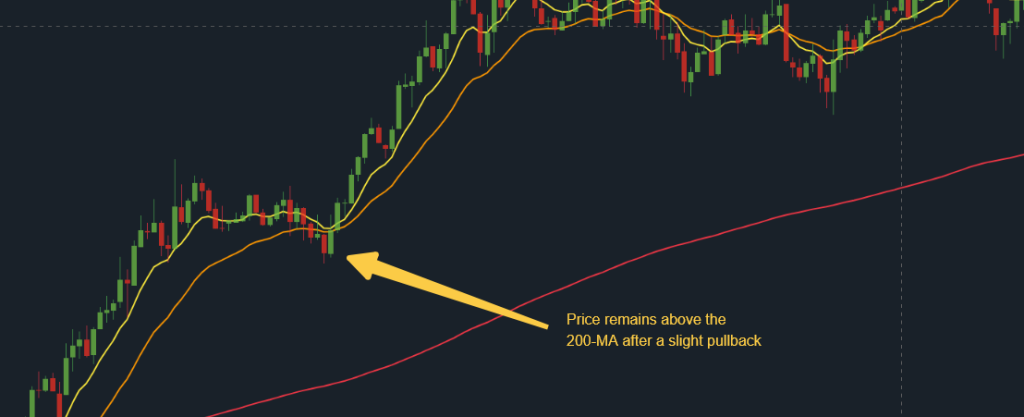
If price remains above the MA, experiences a temporary dip without breaking below, and then resumes its ascent, it may signify an opportunity to add or initiate a long position.
3.2 Potential Moving Average Sell Signals
Scenario 1:
After a sustained rise, if the MA begins to flatten or decline and a short-term MA crosses below a long-term MA, this can be interpreted as a sell signal.
Scenario 2:
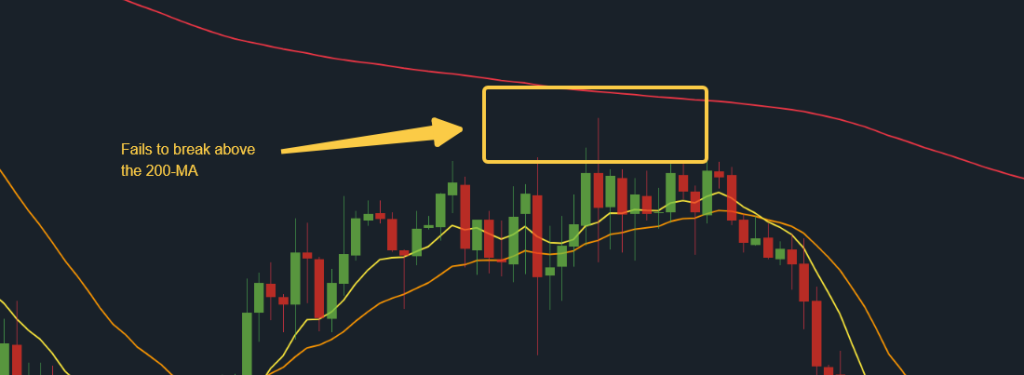
If price falls below the MA and the MA continues trending downward, this supports a bearish outlook. Similarly, when price rallies from below but fails to close above the MA, it reinforces selling pressure.