
1. What is the Fibonacci Retracement Tool?
The Fibonacci retracement is a charting tool used to identify potential pullback zones inside a trend.
The tool plots a series of horizontal levels, typically between 0% and 100%, that mark potential support or resistance areas.
The most commonly observed retracement levels include 23.6%, 38.2%, 50%, and 61.8%. Additional levels may be added depending on the trading methodology, but these serve as the standard reference points.
Fibonacci retracement levels act as a structural map for locating potential reaction zones during corrective phases.
The tool does not predict the exact turning point of price movement; instead, it highlights levels where reversals are statistically more likely to occur.
Among all levels, 38.2% and 61.8% are widely monitored, as market price frequently revisits these zones during retracements, making them notable areas for evaluating potential trading opportunities.
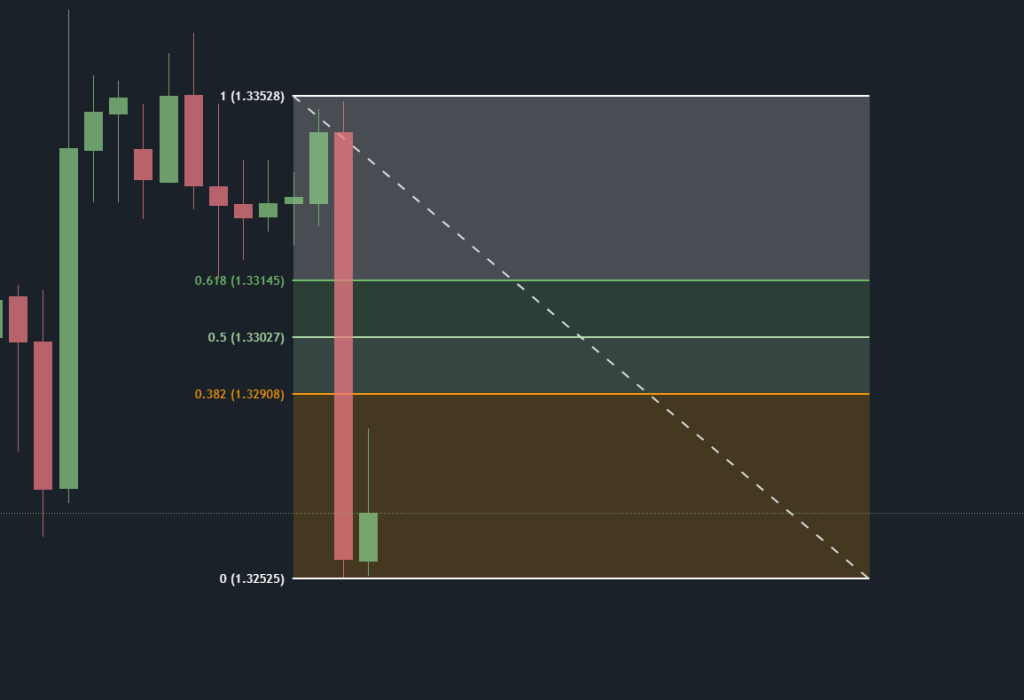
2. How to use the Fibonacci Retracement Tool in trading?
When analysing trends, either upward or downward, the Fibonacci tool is applied to measure the depth of a pullback.
Step 1: Identify the Swing Points
Find the highest high and lowest low within a trend. These are then selected as anchor points for the Fibonacci retracement tool.
Once the two points are marked, the tool automatically generates key retracement levels, including 23.6%, 38.2%, 50%, and 61.8%.
These levels represent potential areas where buying or selling pressure may emerge.
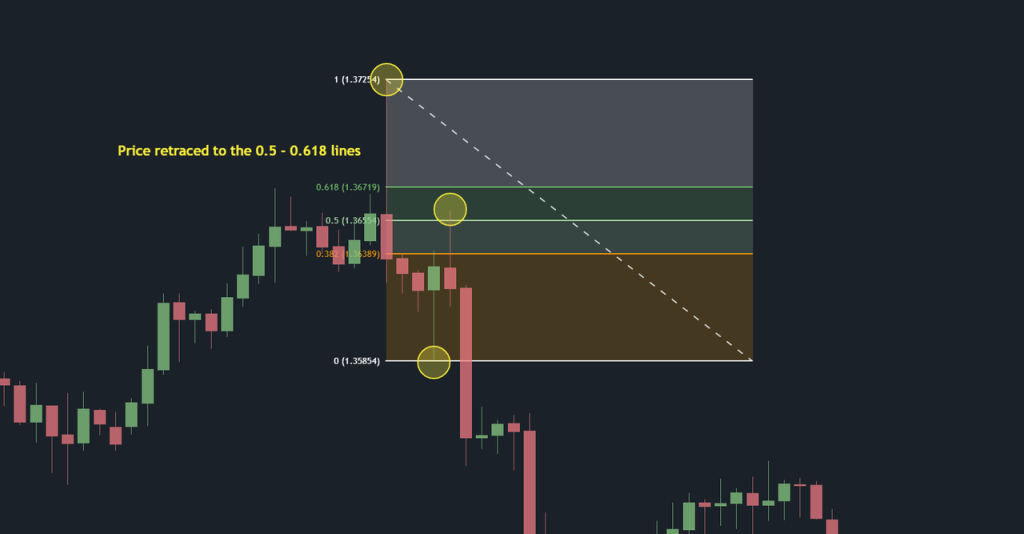
Step 2: Evaluate Price Reaction at Key Levels
Retracement levels such as 38.2% and 61.8% commonly act as optimal re-entry zones within a trend. Price behaviour around these areas often provides insight into trend continuation potential.
A trade plan may be constructed by observing whether price shows rejections, consolidations, or reversal candlestick patterns at these levels, signaling potential long or short entries depending on trend direction.
3. Common mistakes when using the Fibonacci tool
Although Fibonacci retracement is widely used, several common errors can reduce its effectiveness:
Mistake 1: Incorrect Swing Point Selection
Retracements must be drawn from clearly defined swing highs and swing lows on the chosen timeframe. Incorrect anchor points produce inaccurate levels, reducing the reliability of the analysis.
Mistake 2: Ignoring Market Structure
Fibonacci levels perform best when supported by confluence factors. For example, a 61.8% retracement level aligned with previous support, resistance, or a trendline carries a higher probability than an isolated Fibonacci level with no structural relevance.
Mistake 3: Using Fibonacci During Consolidation or High-Impact News
During sideways price action or major news releases, Fibonacci reactions tend to be less consistent. Retracement-based setups are more effective when applied to clear trending environments and stable market conditions.