
1. What is the CCI?
The Commodity Channel Index (CCI) measures whether a financial instrument’s price is beyond the normal distribution range.
It is another indicator that highlights whether a financial instrument is overbought or oversold.
Most indicators that evaluate overbought and oversold conditions, such as the KDJ indicator, Williams %R, or RSI, move between a “0 and 100” range.
A key difference is that the CCI has no hard limits, meaning it is not confined between 0 and 100.
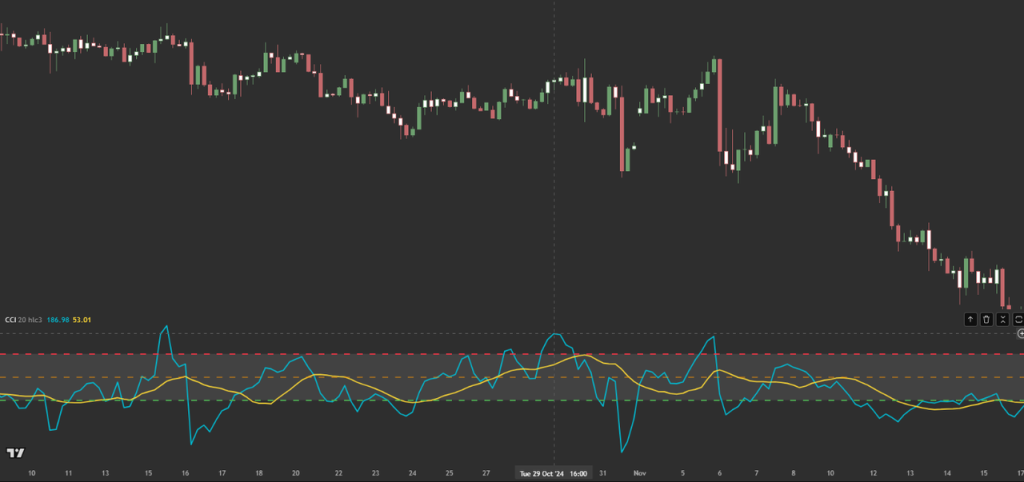
2. Applying the CCI in Trading
When we see the CCI surpass the 100 mark, this may indicate the price has entered oversold territory, and traders may want to consider exiting a position, or searching for a potential shorting position. The same can be said when the price falls below the 0 mark.
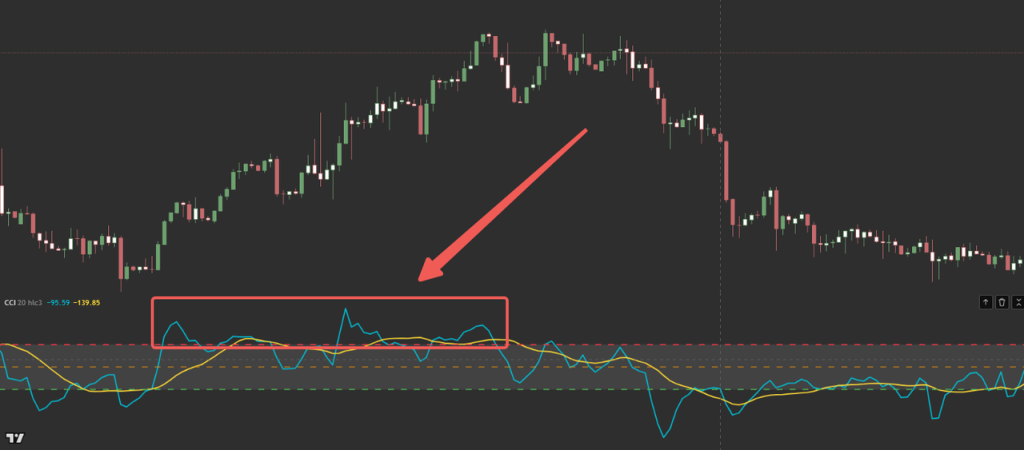
The CCI can also be used to understand how a trend is performing. For example, if the CCI remains above the 100 mark during an uptrend, this could signal that the uptrend is strong and may continue.
However, if the price is making new higher highs, yet the CCI remains low, this could signal the trend is weakening, and traders may want to consider exiting their positions.
The CCI can produce false signals during volatile markets; it is most effective when used alongside other technical indicators or market structure strategies to provide confirmation.