
1. What is a trendline?
A trendline is a visual representation of market direction.
It connects two or more significant price points and illustrates whether the market is trending upward, downward, or moving sideways.
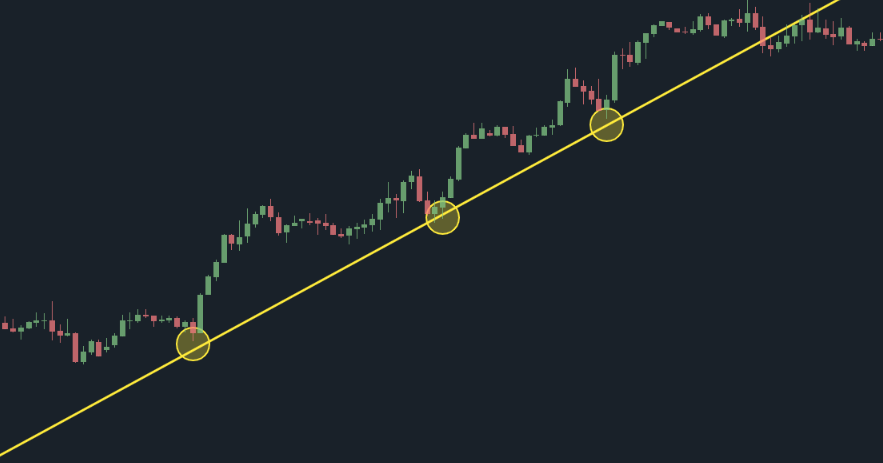
Uptrend Trendline
In an uptrend, a trendline connects higher lows, showing that buyers are consistently stepping in at higher prices.
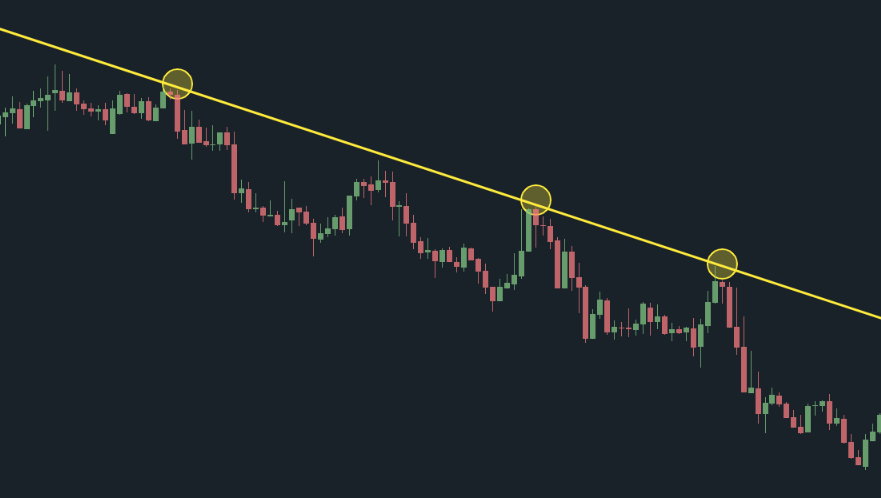
Downtrend Trendline
In a downtrend, a trendline connects lower highs, signalling that sellers are in control.
Think of trendlines as the heartbeat of the market, the rhythm that shows where pressure builds and where it releases.
Their value lies in their simplicity – they rely on price structure rather than complex indicators, making them a foundational tool in technical analysis.
2. How to Draw Trendlines
Trendlines typically follow a systematic, step-by-step process:
Step 1: Identify the Trend
Before drawing any line, the broader market direction must be assessed.
Is the price generally moving up, down, or sideways?
- Ascending trendlines are applied only in uptrends.
- Descending trendlines are applied only in downtrends.
Accurate trend identification forms the basis of reliable trendline analysis.
Step 2: Find the Key Swing Points
Trendlines must anchor to clear structural points:
- In an uptrend, connect the two most prominent swing lows, areas where the price declined and then moved upward.
- In a downtrend, connect the two most prominent swing highs, areas where the price advanced and then reversed downward.
A valid trendline requires at least two touches, while three or more touches significantly increase its reliability.
The more the market respects the line, the stronger the trendline becomes.
Step 3: Adjust to Fit the Market
Trendlines should not be forced to fit a preconceived bias.
If price action does not align with the initial drawing, the trendline may be adjusted slightly while remaining anchored to the key swing points.
The objective is not precision to the pixel but capturing the direction and rhythm of the move.
Step 4: Extend the Trendline Forward
Once established, the trendline is extended into future price action.
This extension serves as a projection tool for potential support (in uptrends) or resistance (in downtrends).
Price may react at these projected areas, offering insight into future market behaviour.
3. Common mistakes when drawing trendlines
Several frequent errors reduce trendline accuracy:
Mistakes 1. Forcing Trendlines to Match a Bias
Trendlines must align with natural market structure. Lines drawn to fit a subjective expectation rather than actual price behaviour are unreliable.
Mistakes 2. Drawing Through Candles or Minor Noise
Trendlines should connect major swing highs and lows, not random intraday fluctuations. Incorrect anchor points lead to misleading signals.
Mistakes 3. Using Only One Timeframe
A trendline that looks perfect on a 5-minute chart might be meaningless on the 4-hour. Trendline analysis should always be confirmed using multiple timeframes, with higher-timeframe structure carrying greater weight.
Mistakes 4. Ignoring Confluence or Additional Confirmation
Trendlines show structure, but confluence gives conviction. Relying solely on a trendline without confirmation increases risk.