1. What Is Forex? (Major vs Minor Currency Pairs)
Forex, short for “foreign exchange”, is the global marketplace where currencies are bought and sold.
It’s the largest and most liquid financial market in the world, with trillions of dollars traded every single day, yes, trillions.
Every Forex trade involves two currencies.
People always buying one while selling the other; this is why Forex is traded in pairs.
Major Pairs
Major pairs all include the US dollar and are the most traded. Examples include:
- EUR/USD
- GBP/USD
- USD/JPY
- USD/CHF
These pairs tend to have lower spreads and higher liquidity.
Minor Pairs
Minor pairs don’t involve the US dollar. Examples include:
- EUR/GBP
- GBP/JPY
- AUD/NZD
They can be slightly more volatile and have higher spreads.
Understanding these pairs is essential, because everything we do in Forex, from analysing price to managing risk, revolves around how these currencies move relative to one another.
2. How the Forex Market Works (Spot, Futures, Sessions)
Forex is unique because it operates 24 hours a day, five days a week.
This is possible because the market follows the sun across the world’s major financial centres.
Forex Sessions:
- Sydney Session
- Tokyo Session
- London Session
- New York Session
The most active periods often occur when sessions overlap, especially London + New York.
3. What Fundamentals Move the Markets?
Now you must have heard the terms technical analysis and fundamental analysis. Whereby technical analysis is solely based on the movements of the candlesticks.
Whereas fundamental analysis is based on actual value, influenced by numerous real-world effects.
In stocks, fundamentals include a company’s revenue, P/E ratio, debt, and assets, among other factors. But forex does not have this type of data.
So how do we analyse Forex fundamentals?
Six highly important pieces of economic data that act as forex fundamentals are listed out here.
| Indicator | Importance | Frequency |
| Interest Rate Decisions | Extremely High | Monthly/Quarterly |
| Non-Farm Payrolls (US, but other countries use different names) | Very High | Monthly |
| Inflation (CPI) | High | Monthly |
| GDP | High | Quarerly |
| Unemployement | Moderate | Monthly |
| PMI Services / Manufacturing | Low | Monthly |
3.1 Interest Rate Decisions
This is often the biggest mover.
- Current Rate: 5.25%
- Expected: No change
- Actual: Rate cut to 5.00%
- Investors flee lower-yield currency
- USD falls across the board
- EUR/USD moves higher
- Gold likely spikes
Even if the rate doesn’t change: hawkish tone = currency up, dovish tone = currency down.
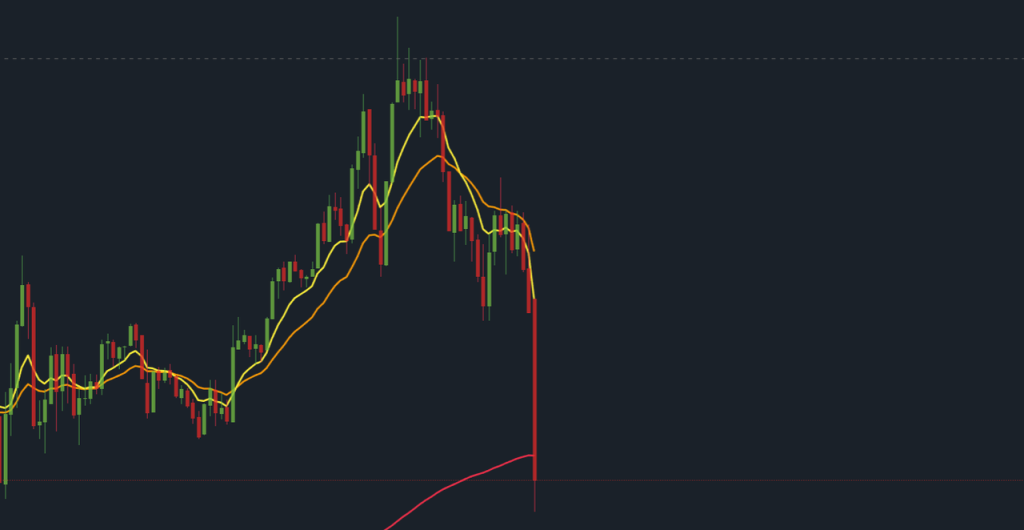
eg. USD/JPY
18th Sept 2024 – 15 minute TF
Before US Interest rate announcement
Previous: 5.5%
Forecast: 5.25%
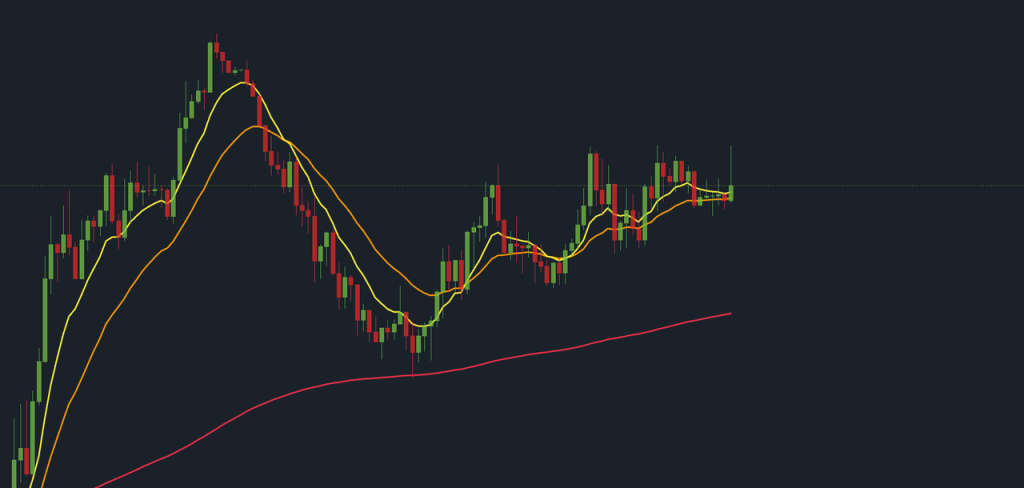
eg. USD/JPY
18th Sept 2024 – 15 minute TF
After US Interest rate announcement
Actual: 5%
3.2 Non-Farm Payrolls (NFP)
If results are HIGHER than expected → Strong economy → USD usually strengthens
If results are LOWER than expected → Weak economy → USD usually weakens
- Forecast: +180,000 jobs
- Actual: +290,000 jobs (much stronger)
- USD/JPY jumps up (USD stronger)
- EUR/USD falls (USD stronger)
Why: More jobs → higher spending → potential rate hikes → stronger USD
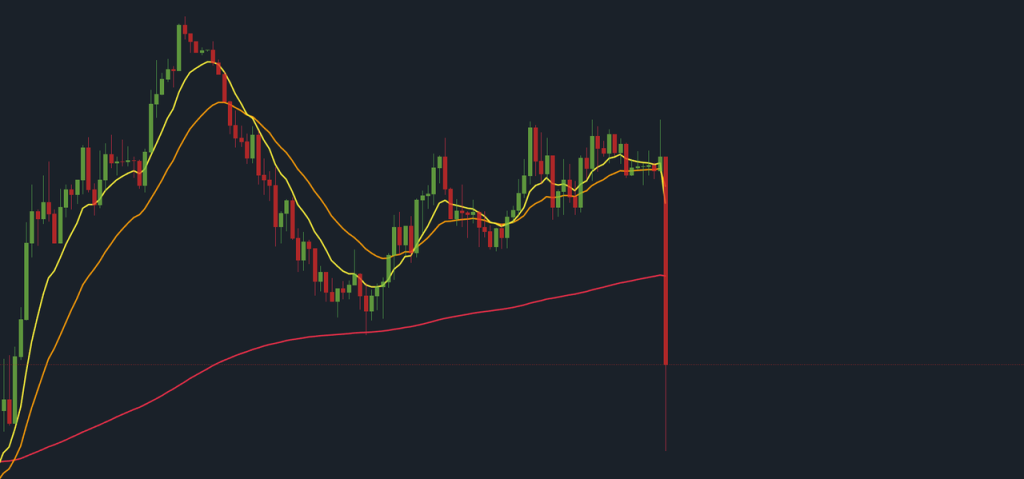
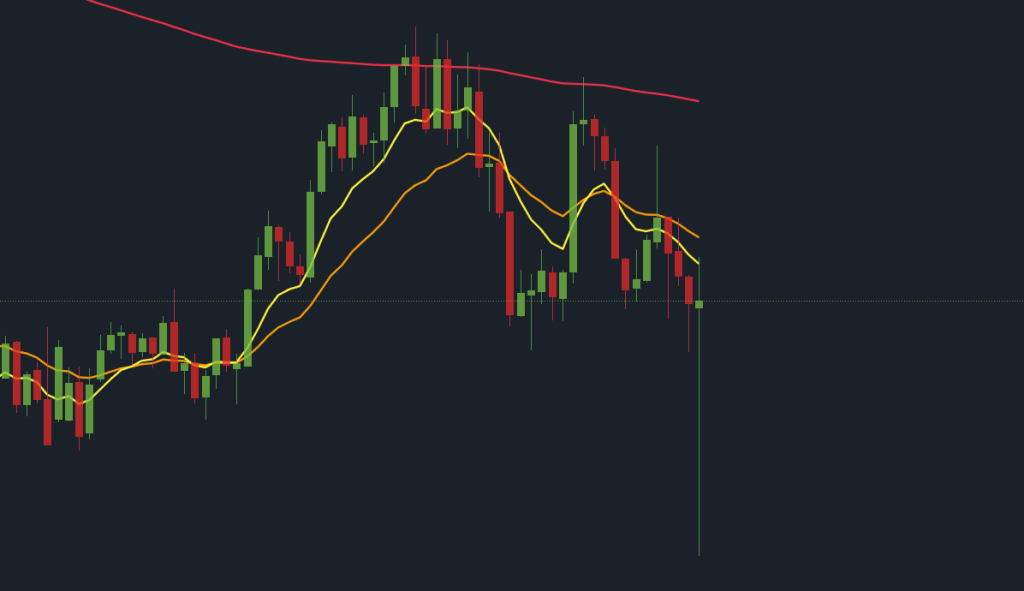
eg. GBP/USD
2nd May 2025 – 15 minute TF
Before US Non-farm
Previous: 185K
Forecast: 130K
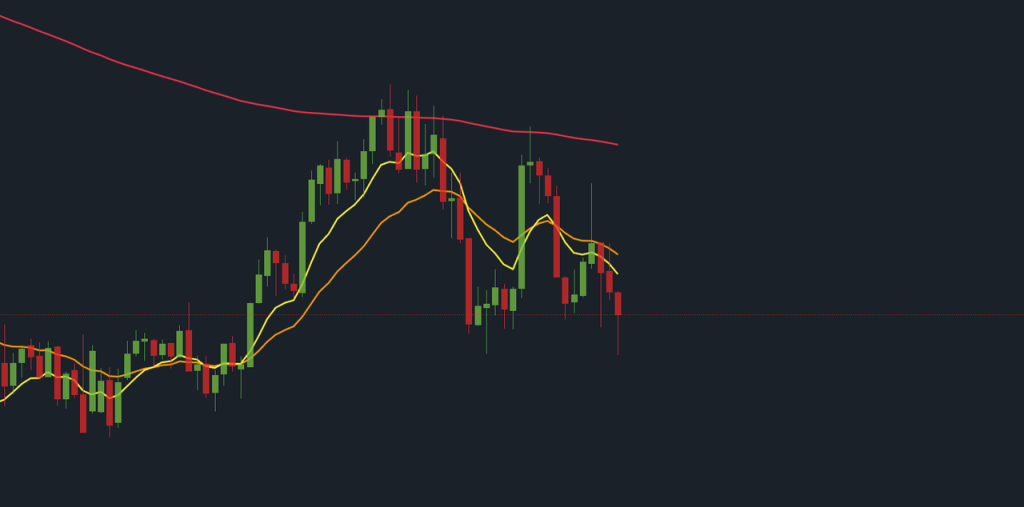
eg. GBP/USD
2nd May 2025 – 15 minute TF
After US Non-farm
Actual: 177K
3.3 Consumer Price Index (CPI) — Inflation Data
Inflation drives central bank decisions.
Example:
- Forecast: 3.1% YoY
- Actual: 4.0% YoY (big inflation miss)
- Markets expect rate hikes
- GBP/USD rises if this were UK data
- USD/CHF rises if this were US data
Opposite scenario:
- Actual comes in below forecast → Rate cuts likely → Currency weakens
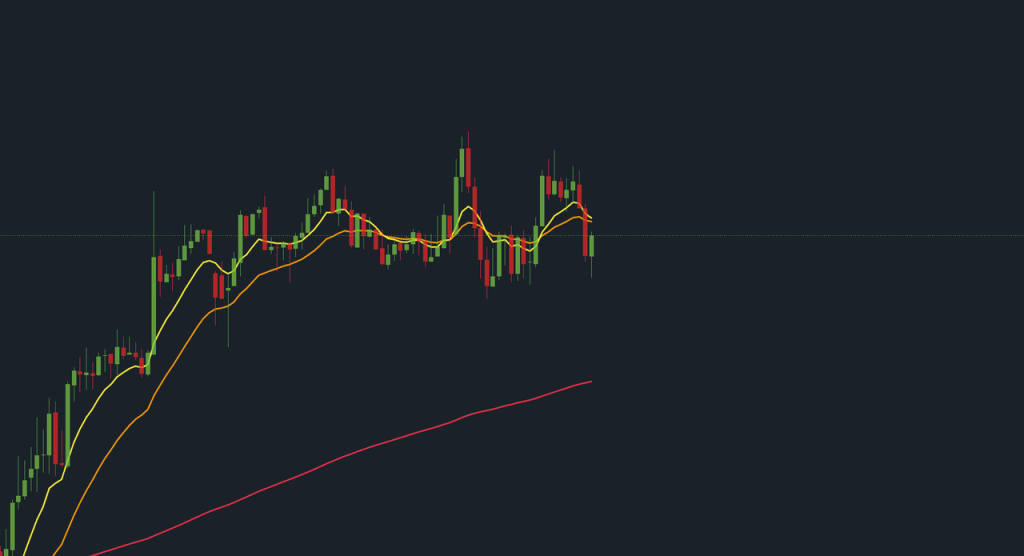
eg. GBP/USD
12th Feb 2025 – 15 minute TF
Before US CPI Inflation Rate Data
Previous: 0.4%
Forecast: 0.3%
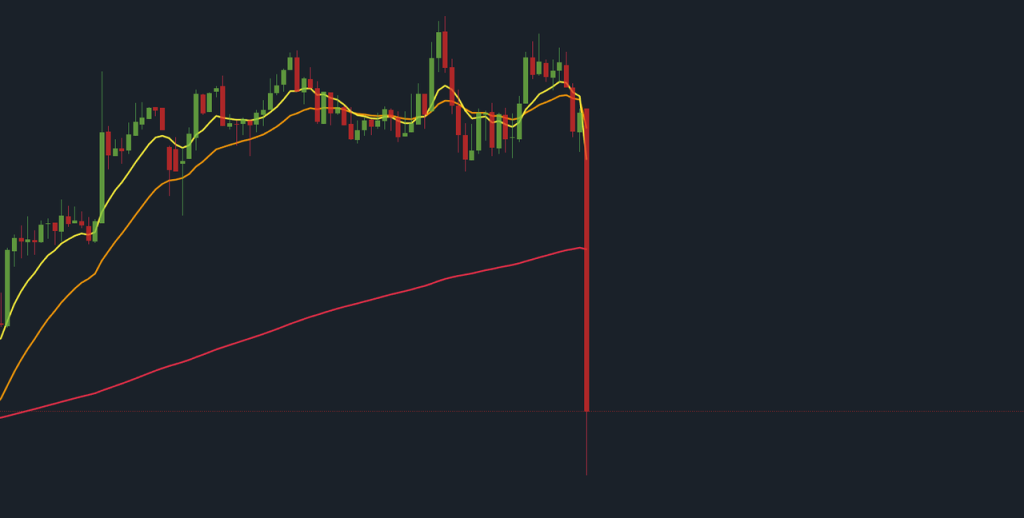
eg. GBP/USD
12th Feb 2025 – 15 minute TF
After US CPI Inflation Rate Data
Actual: 0.5%
3.4 GDP Growth
Measures national economic performance.
Example:
- Forecast: +1.8%
- Actual:+0.3%
- Weak growth → Weak currency
- EUR/USD rises if there’s poor U.S. GDP
- USD/JPY falls
Opposite also true: If GDP beats forecasts, currency usually strengthens.
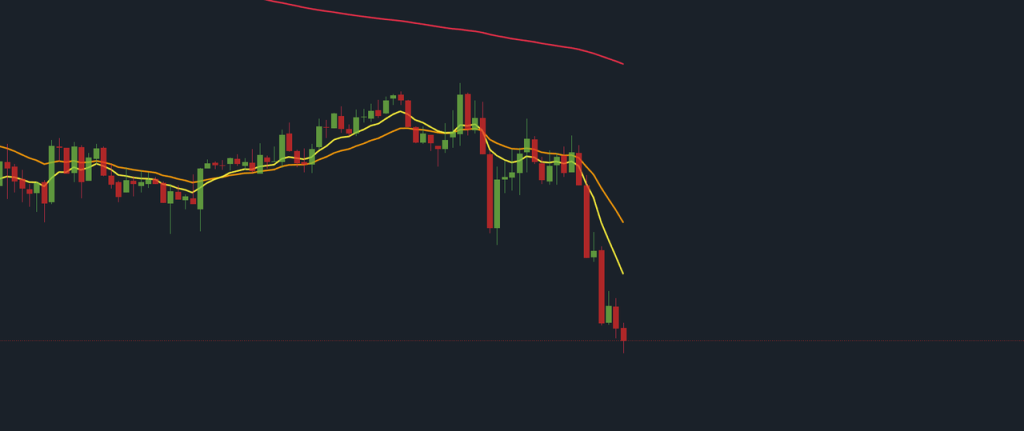
eg. GBP/USD
25th September 2025 – 15 minute TF
Before US GDP QoQ Final
Previous: -0.6%
Forecast: 3.3%
eg. GBP/USD
25th September 2025 – 15 minute TF
After US GDP QoQ Final
Actual: 3.8%

3.5 Unemployment Rate
Shows % of people actively looking for work but jobless.
Example:
- Forecast: 4.0%
- Actual: 4.4% (worse than expected) → USD drops
Reason: More unemployment = economy weakening = rate cuts more likely
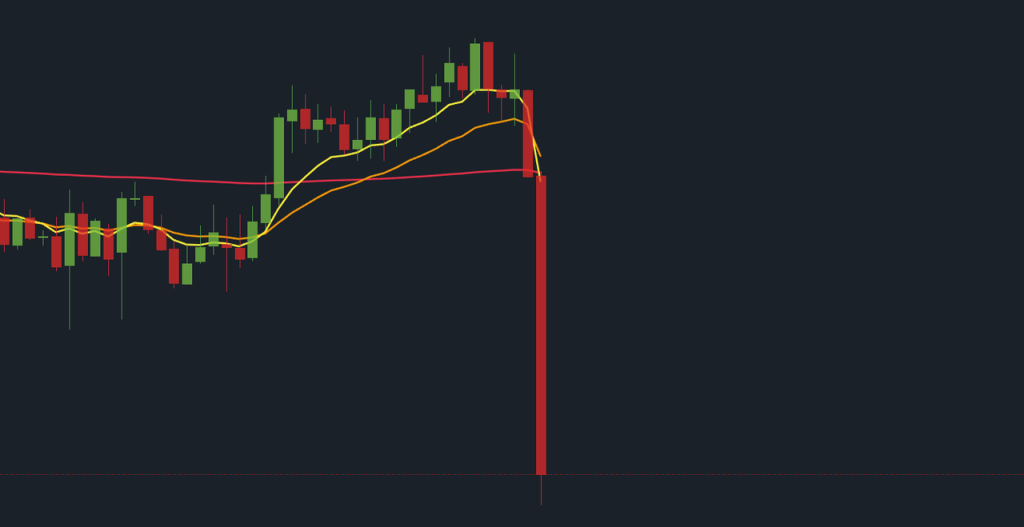
eg. GBP/USD
14th October 2025 – 15 minute TF
Before the UK Unemployment Rate
Previousa: 4.7%
Forecast: 4.7%
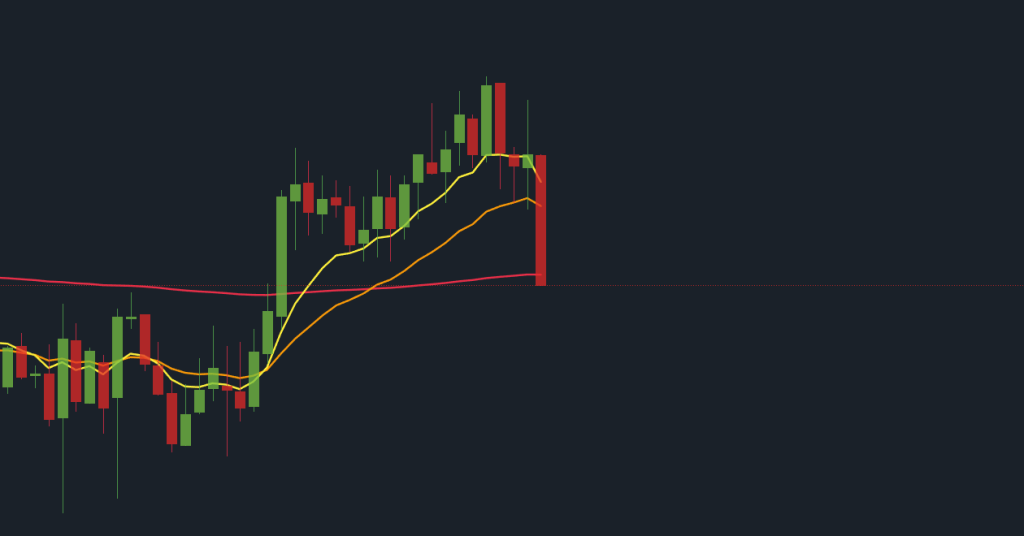
eg. GBP/USD
14th October 2025 – 15 minute TF
After the UK Unemployment Rate
Actual: 4.8%
3.6 PMI – Purchasing Managers’ Index
Measures business expansion or contraction. (Above 50 = growth | Below 50 = contraction)
Example:
- Forecast: 50.8
- Actual: 47.2 (below expansion line) → USD falls rapidly
Reason: Early signal economy is slowing → bearish for currency
eg. GBP/USD
7th Jan 2025 – 15 minute TF
Before the US Services PMI
Previous: 52.1
Forecast: 53.3
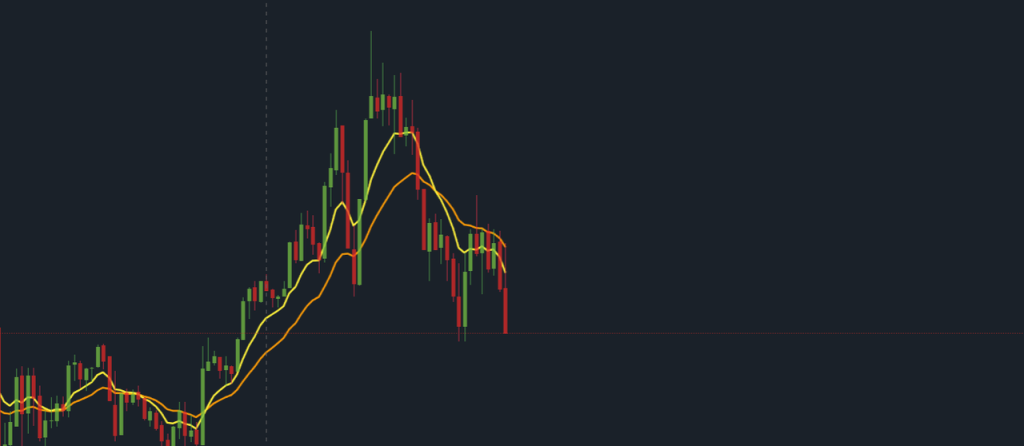
eg. GBP/USD
7th Jan 2025 – 15 minute TF
After the US Services PMI
Actual: 54.1