
The Moving Average Convergence Divergence (MACD) is one of the most widely used tools in technical analysis. It assists market participants in determining whether market momentum favors a buy or sell position, thereby serving as a key decision-making indicator in trend-following and momentum-based strategies.
1. What is the MACD?
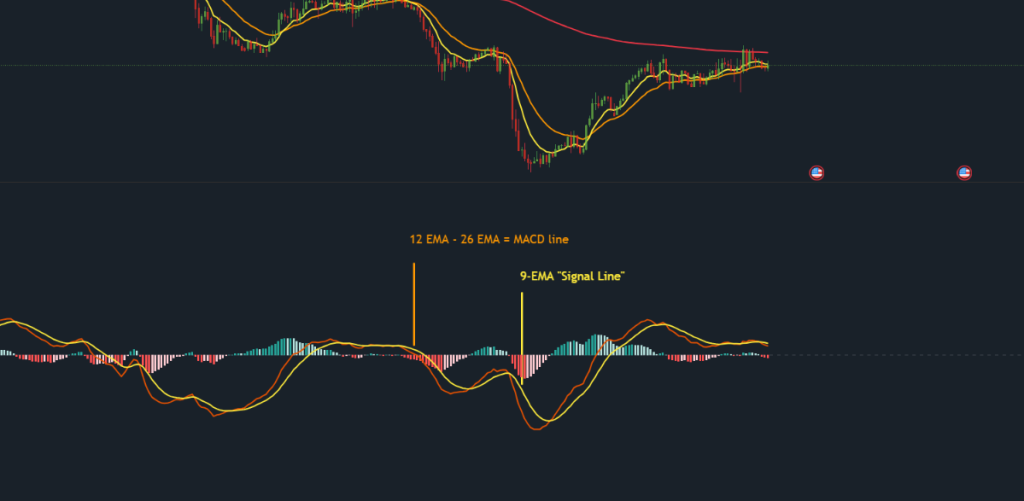
The MACD is constructed from two Exponential Moving Averages (EMAs) of price, which measure momentum and trend direction.
The calculation is as follows: MACD Line = 12-Period EMA − 26-Period EMA
This MACD line is then smoothed with another moving average, known as the Signal Line (also referred to as the DEA Line).
Together, the MACD and Signal Line illustrate the relationship between short-term and long-term momentum. The interaction between these lines helps identify potential trend shifts and entry or exit signals.
2. Application of the MACD in Trading
If both the MACD line and signal lines have just crossed above the MACD histogram, the market is signalling a bullish sentiment and signals to traders to take a potentially long position.
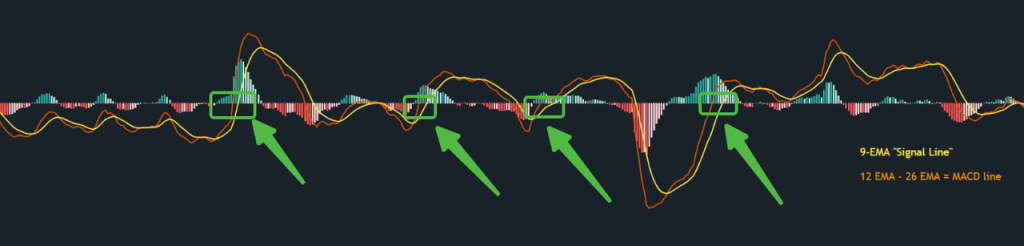
If both lines cross below the MACD histogram, then the market is weak and indicates a potential short signal.
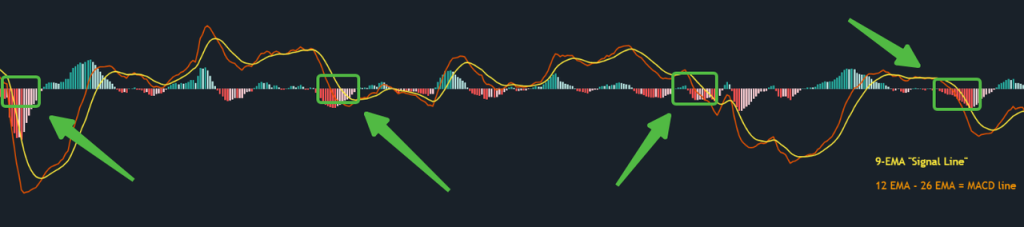
When theMACD line crosses above the signal line, that could be a nice indication that the market is turning bullish.
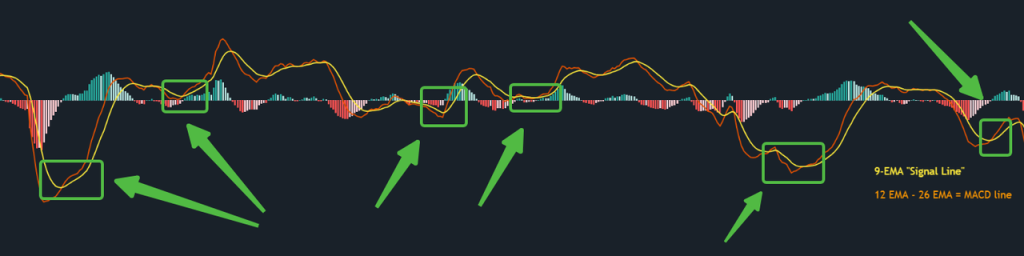
And when theMACD line crosses below theSignal line, that could signal the market is about to turn bearish.
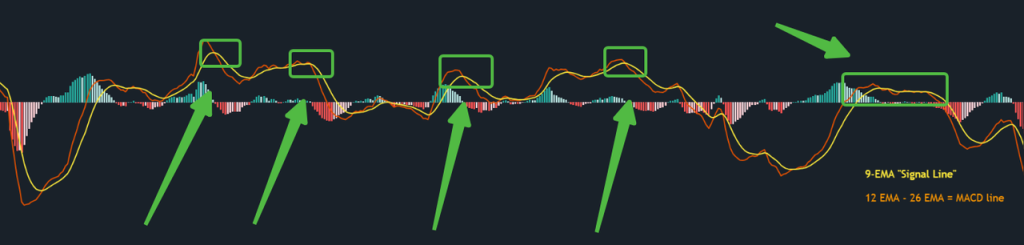
The MACD is frequently used as a confirmation indicator rather than a standalone signal generator. Traders and analysts often combine MACD signals with other forms of technical analysis—such as trendlines, moving averages, or support and resistance—to enhance trade validation and reduce false entries.
3. Advantages of the MACD Indicator
The MACD indicator provides a clear representation of both market momentum and trend direction, making it a valuable tool for identifying potential reversals following steep declines or inclines.
It’s especially powerful for medium and long-term strategies, where it helps smooth market noise and highlight genuine shifts in momentum.
By filtering out false signals, the MACD indicator has the potential to reduce bad trades and can help traders refine the accuracy of their entry points.