1. What is the KDJ indicator?
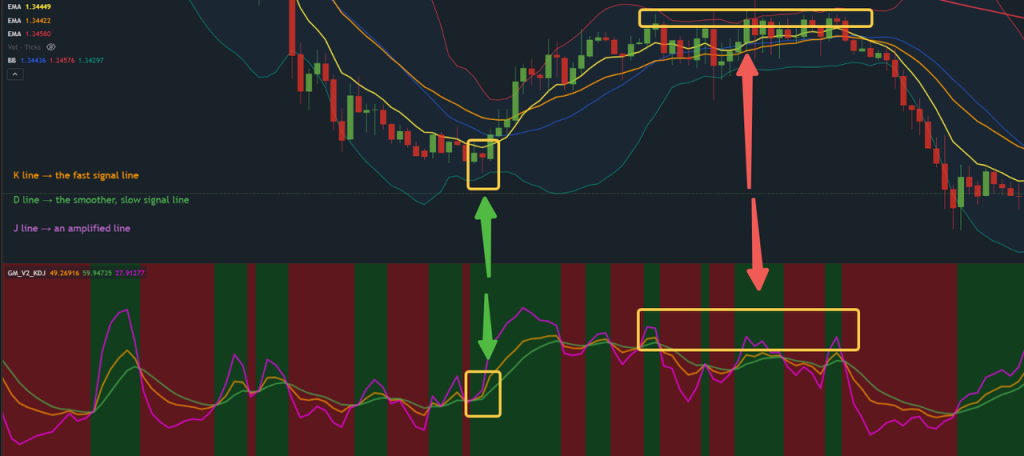
The KDJ indicator is a momentum oscillator. It helps traders see whether a market is overbought or oversold, and it gives signals when trends might be about to change.
It consists of three lines:
- K line → the fast signal line
- D line → the smoother, slow signal line
- J line → an amplified line that exaggerates the difference between K and D, making buy and sell signals easier to spot
2. How do traders read the KDJ indicator?
The indicator ranges between 0 and 100. Traders generally interpret the readings as follows:
- When the lines rise above 80, the market is considered overbought, meaning a downward reversal may be near.
- When the lines fall below 20, the market is considered oversold, and an upward reversal may follow.
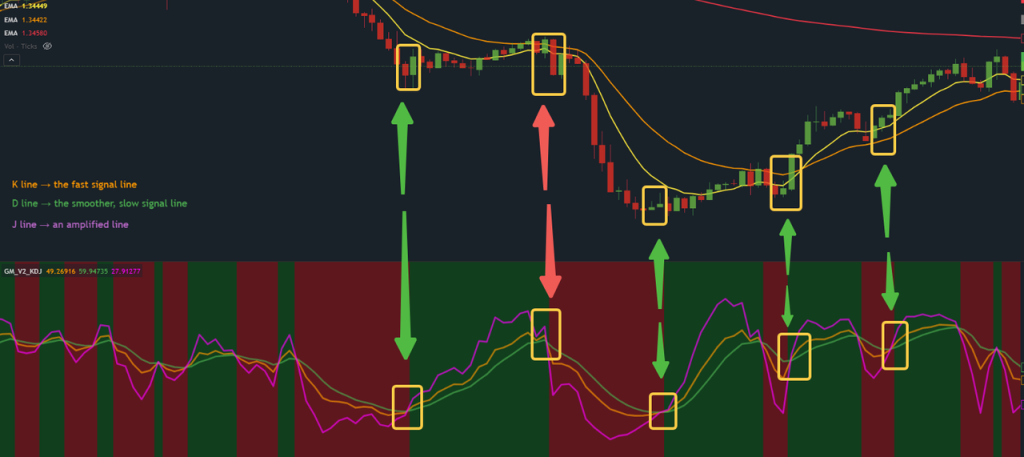
A key signal occurs when the K line crosses the D line:
- K crosses above D → potential bullish reversal
- K crosses below D → potential bearish reversal
The key features of the KDJ indicator is, that it is more sensitive than the standard Stochastic indicator, as it is able to catch turns within the market earlier, but can also be more prone to false signals.
For this reason, traders often combine the KDJ with other indicators, such as MACD or Bollinger Bands, to confirm whether a breakout or reversal is valid.