1. What is the RSI?
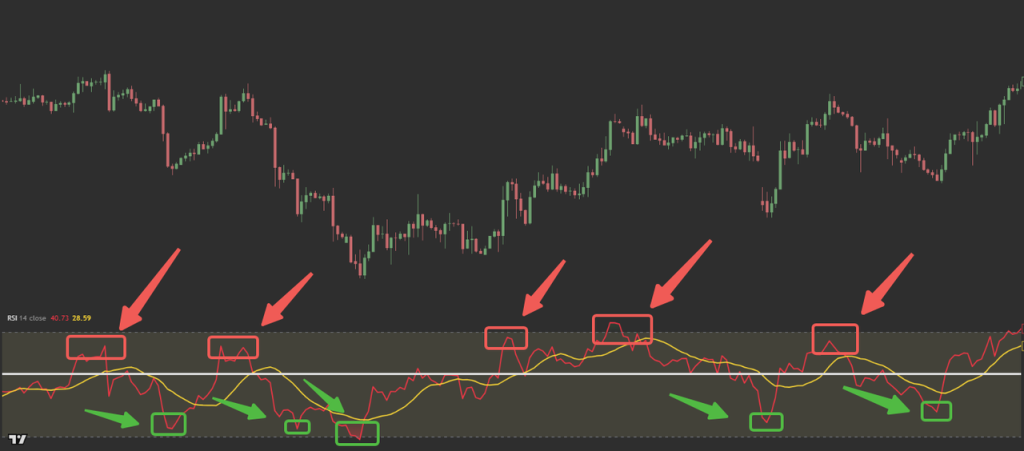
The Relative Strength Index (RSI) is a momentum indicator used in technical analysis to measure the magnitude of recent price changes and determine whether a financial instrument is overbought or oversold.
The RSI is presented as an oscillator, moving between 0 and 100, and is calculated using the average gains and losses over a specified period.
The primary purpose of the RSI is to evaluate whether current price levels are stretched relative to recent price behavior, which may signal a potential reversal.
2. Using the RSI
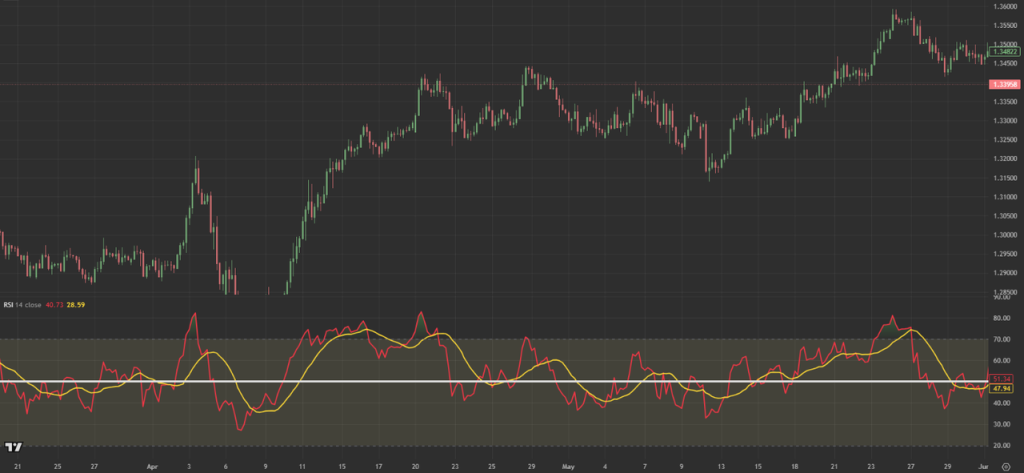
The RSI is commonly used as a supporting indicator, often paired with tools such as KDJ, MACD, or Bollinger Bands to strengthen confirmation signals.
The RSI highlights to a trader whether a financial instrument is potentially overbought or oversold, and can provide us with an indication as to whether a reversal is ahead.
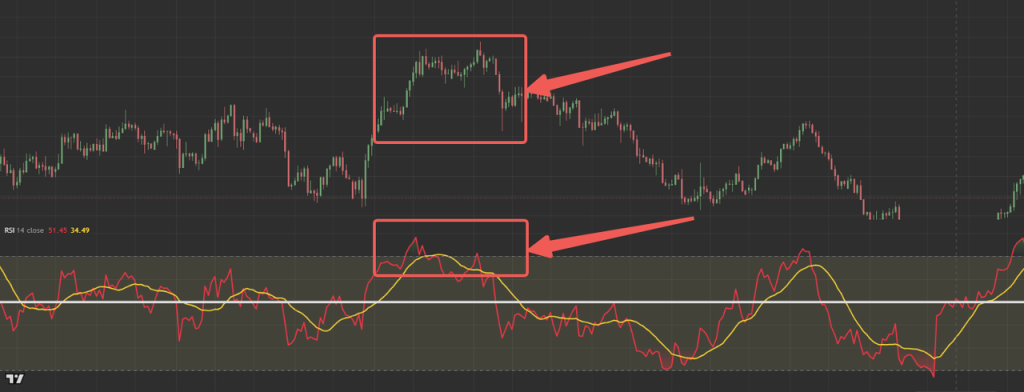
For example, when the RSI rises above 70, the asset is considered overbought, suggesting that upward momentum may be weakening and a downward reversal could develop.
This is often a zone where traders consider taking profit on long positions or preparing for potential shorting opportunities.
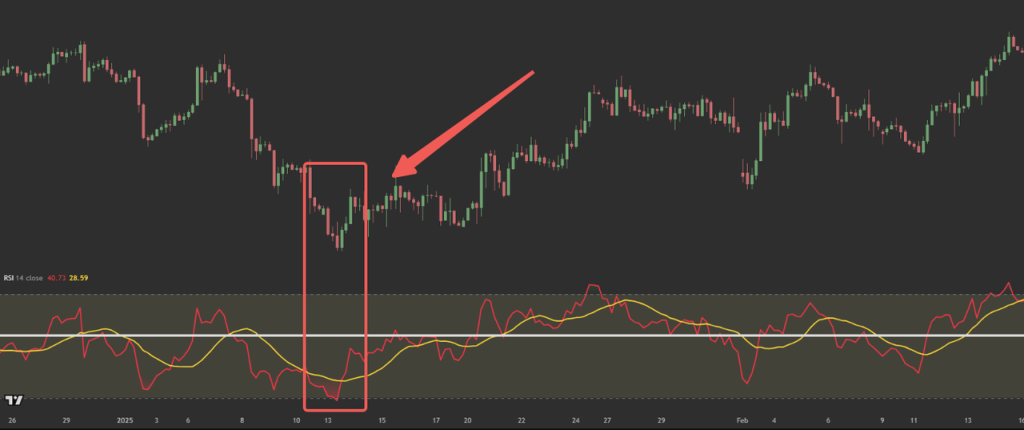
When the RSI falls below 30,or in more aggressive scenarios, below 20,the asset is considered oversold, signalling that downward momentum may be slowing, and an upward reversal could be forming.
In addition to overbought/oversold readings, traders also monitor the shape of the RSI line.
When the line begins to flatten, curve, or bend toward the opposite direction, this can indicate weakening momentum and a possible trend reversal.