
1. Types of Chart Patterns
Chart patterns are recurring shapes that form on price charts and are used to assess potential future price movements based on historical price behavior.
They form a core component of technical analysis, requiring a clear understanding of price structure, market psychology, and trend behavior.
Chart patterns are generally categorized into three groups:
- Bullish Patterns
- Bearish Patterns
- Reversal Patterns
Each category provides insight into potential trend continuation or reversal scenarios.
2. Head and Shoulders
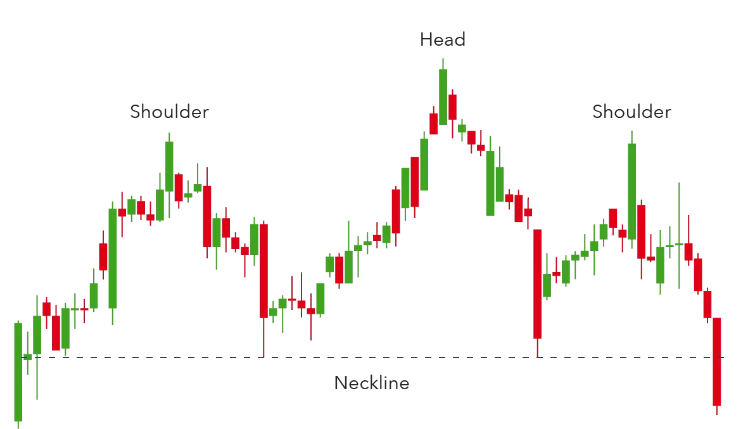
The Head and Shoulders pattern is a well-known bearish reversal pattern.
It consists of:
- A higher central peak (the head)
- Two lower peaks on either side (the shoulders)
This formation signals a potential transition from a bullish trend to a bearish trend.
The Inverse Head and Shoulders is the mirrored version and represents a bullish reversal pattern, indicating a potential shift from bearish to bullish market conditions.
3. Double Top
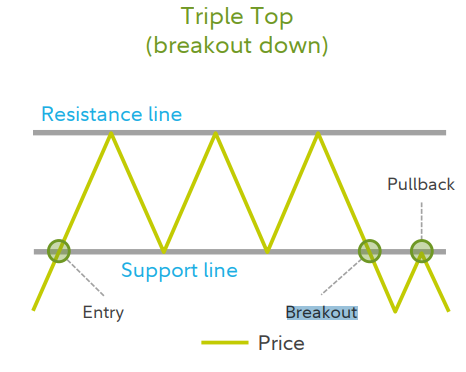
The Double Top is a bearish reversal pattern that appears after an uptrend.
It forms when:
- Price reaches a resistance level
- Pulls back to support
- Attempts to break higher a second time but fails
This repeated rejection suggests weakening buying pressure and increases the probability of a downward reversal.
A Triple Top follows the same logic, with a third failed breakout attempt, further strengthening the bearish signal.
4. Double Bottom
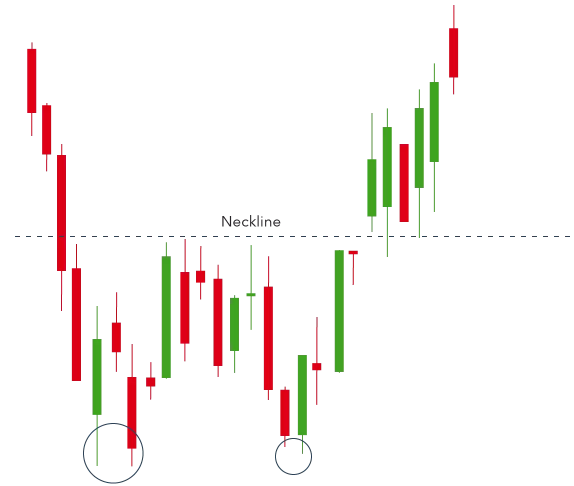
The Double Bottom is the bullish counterpart to the Double Top.
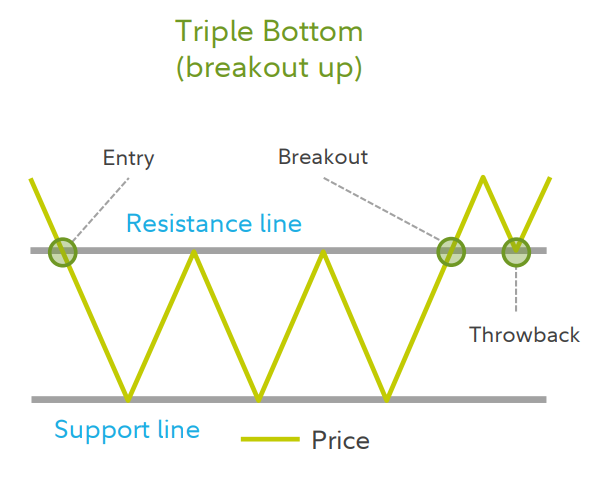
It forms when:
- Price tests a support level twice
- Fails to break lower
- Breaks above resistance afterward
This pattern indicates increasing buying strength and a potential upward reversal.
A Triple Bottom follows the same structure, with three failed breakdown attempts, often strengthening the bullish bias.
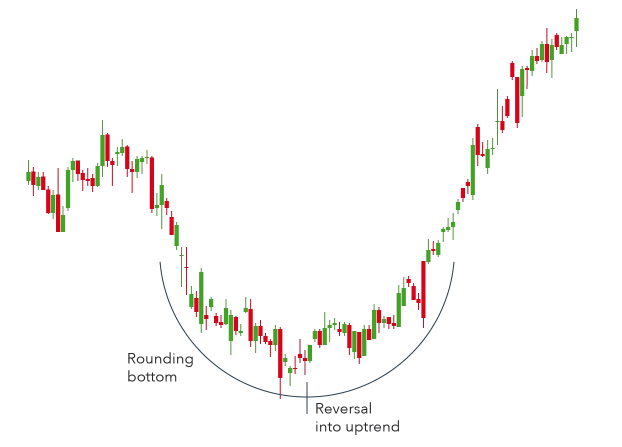
5. Rounding Bottom
The Rounding Bottom is a bullish reversal pattern that forms gradually.
It is characterized by:
- A curved, rounded price structure
- A slow transition from bearish to bullish momentum
This pattern suggests that selling pressure is diminishing and accumulation is occurring. A breakout above resistance often confirms the reversal.
6. Cup and Handle
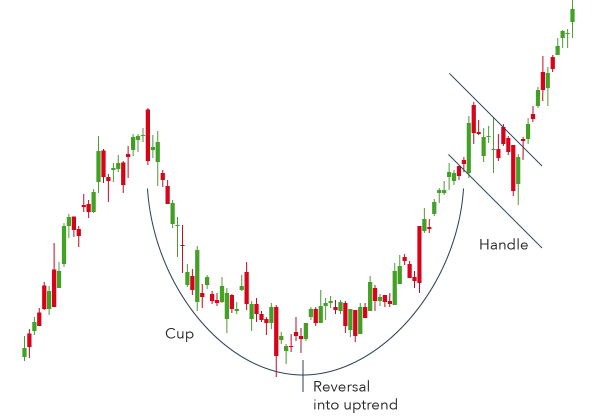
The Cup and Handle is a bullish continuation pattern.
It consists of:
- A rounded bottom (the cup)
- A brief consolidation or pullback (the handle)
After the handle forms, price typically breaks above resistance and continues the prevailing bullish trend.
7. Wedge
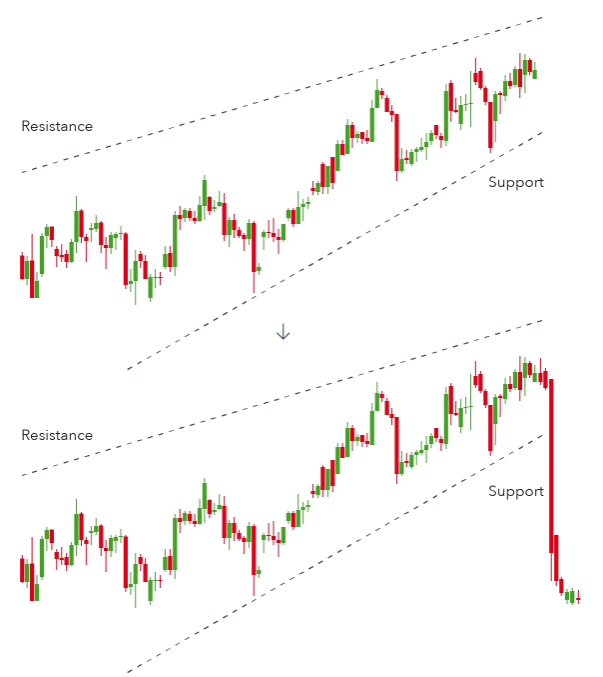
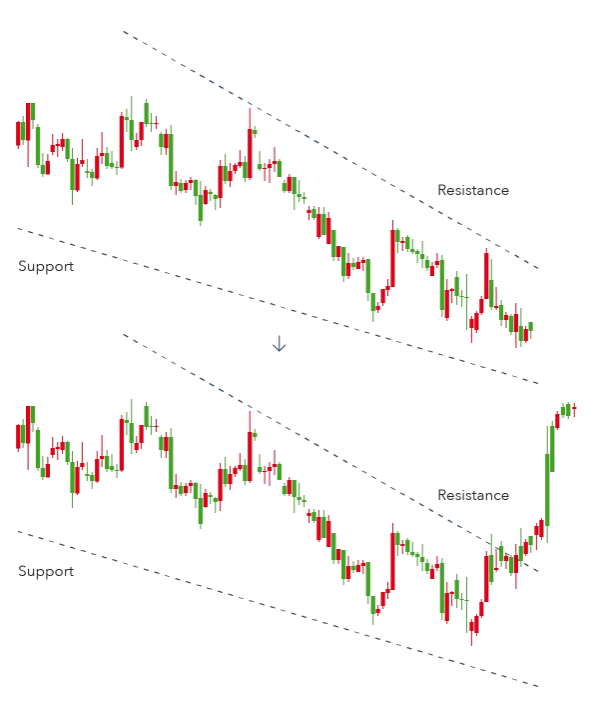
Wedges form when price action narrows between two converging trendlines.
Rising Wedge
- Slopes upward
- Support line is steeper than resistance
- Often signals a bearish reversal or continuation to the downside
Falling Wedge
- Slopes downward
- Resistance line is steeper than support
- Often signals a bullish reversal or continuation to the upside
Both wedge types can act as reversal or continuation patterns, depending on market context.
8. The flag Patterns
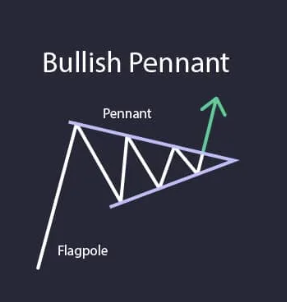
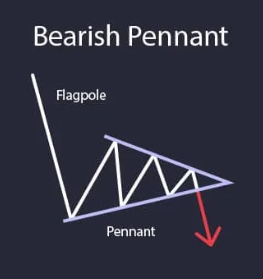
The flag patterns typically form after a strong price movement, followed by a period of consolidation.
Bullish Pennant
- Forms after a strong upward move
- Price consolidates with higher lows and lower highs
- Often breaks upward in the direction of the trend
Bearish Pennant
- Forms after a strong downward move
- Consolidation occurs before continuation to the downside
9. Ascending and Descending Triangle Patterns
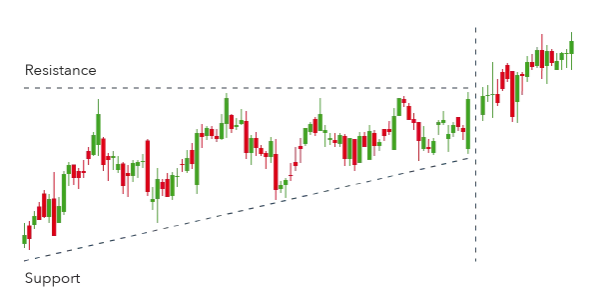
Ascending Triangle
- Bullish continuation pattern
- Flat resistance level
- Rising support line
- Breakout above resistance signals continuation upward
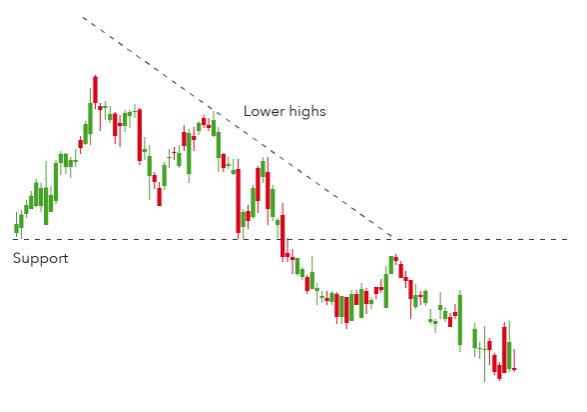
Descending Triangle
- Bearish continuation pattern
- Flat support level
- Falling resistance line
- Breakdown below support signals continuation downward
10. Summary of Chart Patterns
Chart patterns are practical tools used to interpret price behavior and market sentiment.
They help identify:
- Support and resistance levels
- Potential trend continuations
- Possible reversal zones
When combined with other forms of technical analysis, chart patterns can enhance trade planning, entry timing, and risk management.